
Know what every customer, lane and contract really earns.
Our Commercial Intelligence Engine turns your own operational and financial data into six commercial models, so decisions on pricing, customers, lanes and tenders are made on facts rather than averages.
Averages hide the truth.
Most logistics businesses know their total revenue and their total cost. Far fewer know which customers, lanes and contracts create their margin — and which quietly consume it.
A customer with a demanding drop pattern, a lane that runs empty on the return leg or a rate card that no longer covers diesel can erode profit for months before it shows in the monthly accounts.
The Commercial Intelligence Engine makes that visible, customer by customer and lane by lane, and keeps it visible every month.
Six models. One commercial picture.
Cost to Serve
What does it really cost to serve each customer? Revenue less transport, warehousing, labour, fuel, subcontracting, handling and overheads — per customer and per delivery, with the cost drivers behind it.
Customer Profitability
Which customers should we grow, fix or re-price? Every customer placed on a matrix of revenue against margin after cost to serve: protect and grow, develop, re-price or restructure.
Lane Profitability
Which lanes generate sustainable margins? Contribution per lane after fuel, driver, tolls, maintenance, depreciation, subcontracting and overheads — per load and per kilometre, classified profitable, marginal or loss-making.
Pricing
Are our rates commercially sustainable? Break-even, minimum and target rates per lane, with fuel adjustment and escalation, compared with what you charge today.
Value Realisation
Did the changes actually deliver value? Results measured against an agreed baseline and reported in rand, so improvement is proven rather than assumed.
Tender & Contract Analysis
Should we bid, and at what rate? Bid or no-bid scorecards, the rate to quote, risk and cash flow for tenders, and health checks and revenue leakage on existing contracts.
From your data to decisions.
Upload your data
Simple templates for daily, weekly, monthly or yearly figures, uploaded by drag and drop.
Checked on arrival
Every file is checked row by row, and anything that needs attention is flagged before a single number is calculated.
Six models calculated
On your own financial year, cost rates and margin thresholds.
Dashboards you control
Customisable dashboards, from the whole business down to a single customer, lane or tender, with export to Excel.
Test before you decide
The Scenario Studio shows the effect of diesel, price, volume and cost changes, break-even points and sensitivity.
Review and act
Monthly reviews and quarterly business reviews with your Saurus consultant keep decisions moving.
Your own secure Client Portal.
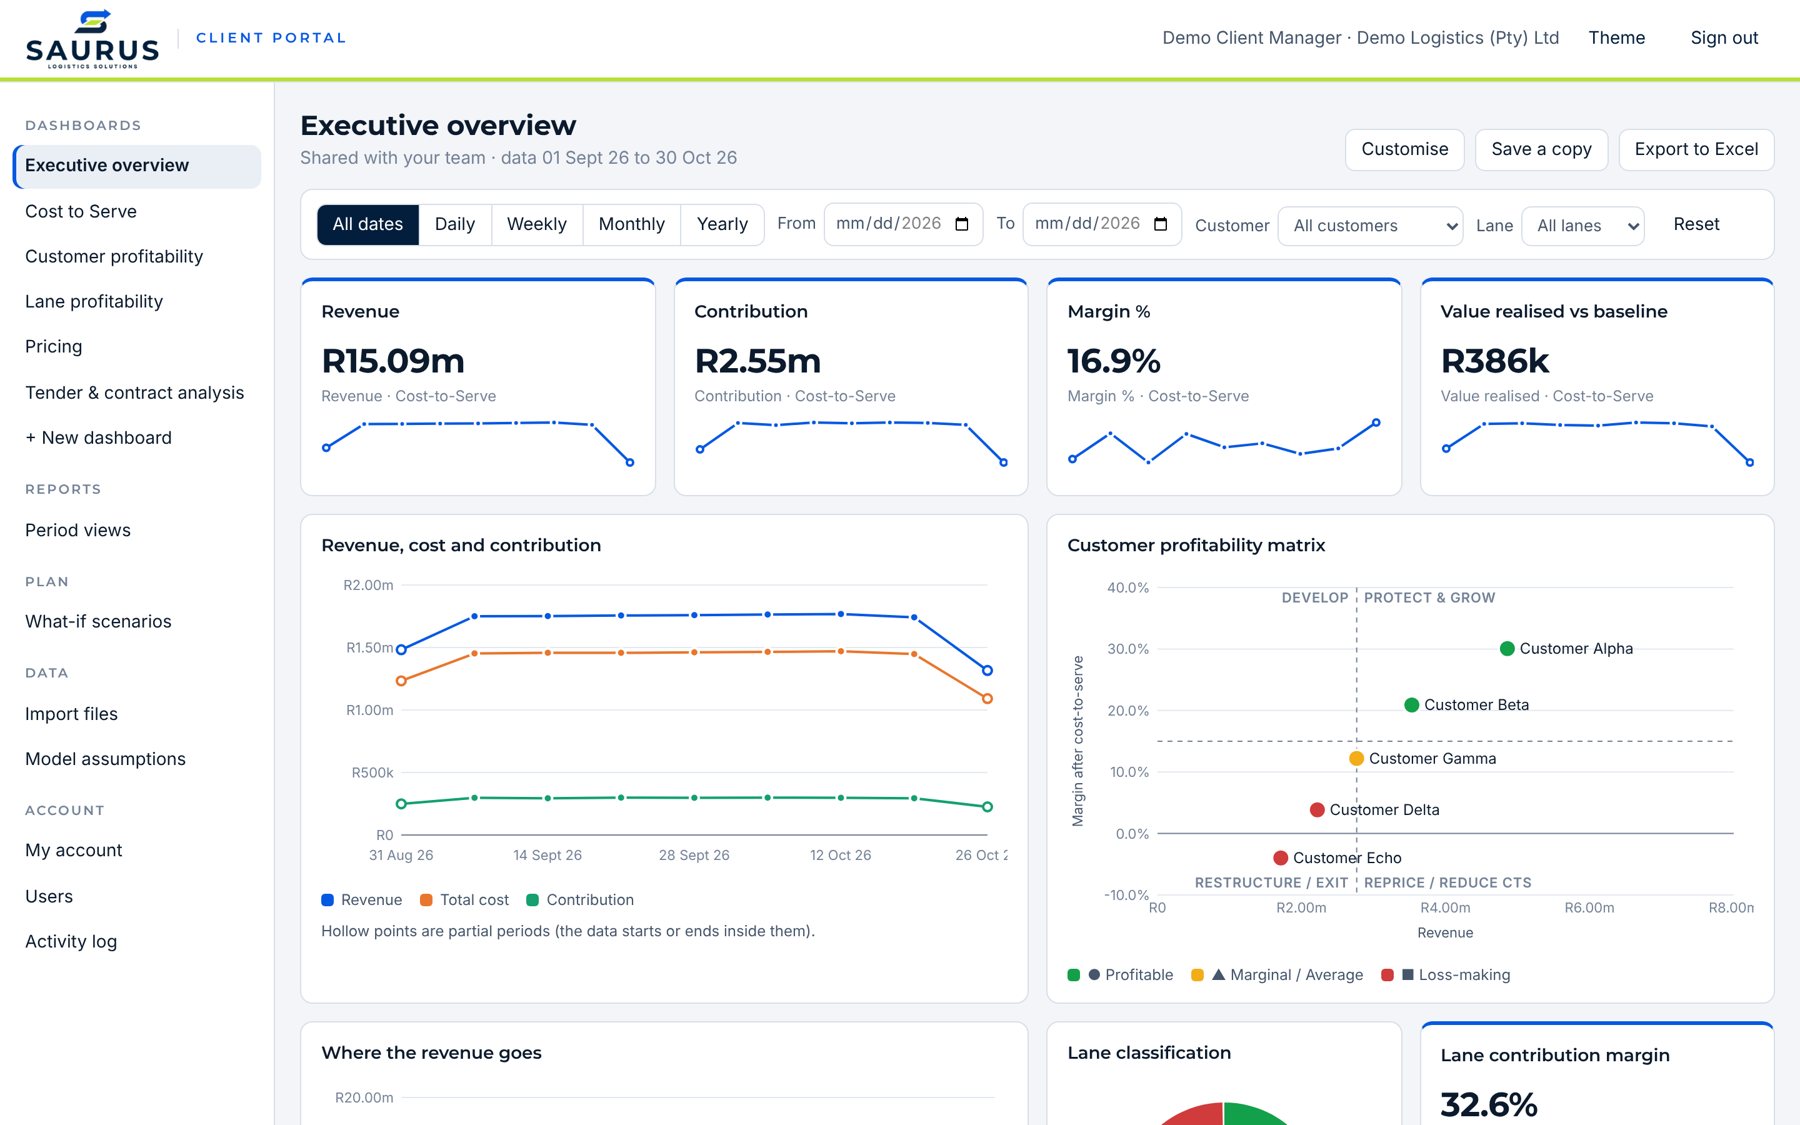
Every client receives a private portal on our website. Your team signs in, uploads data and works with live dashboards — on any device, at any time.
- Daily, weekly, monthly and yearly views on your financial year
- Drill from the whole business to a single customer, lane or tender
- Scenario Studio for what-if decisions before you commit
- Each client's data kept strictly separate, with secure sign-in, encrypted connections and automatic sign-out
- Your data is used only to deliver your service, in line with POPIA
Start with a Logistics Diagnostic.
We begin with your data and a clear view of where margin is made and lost — then show you the opportunity in rand.